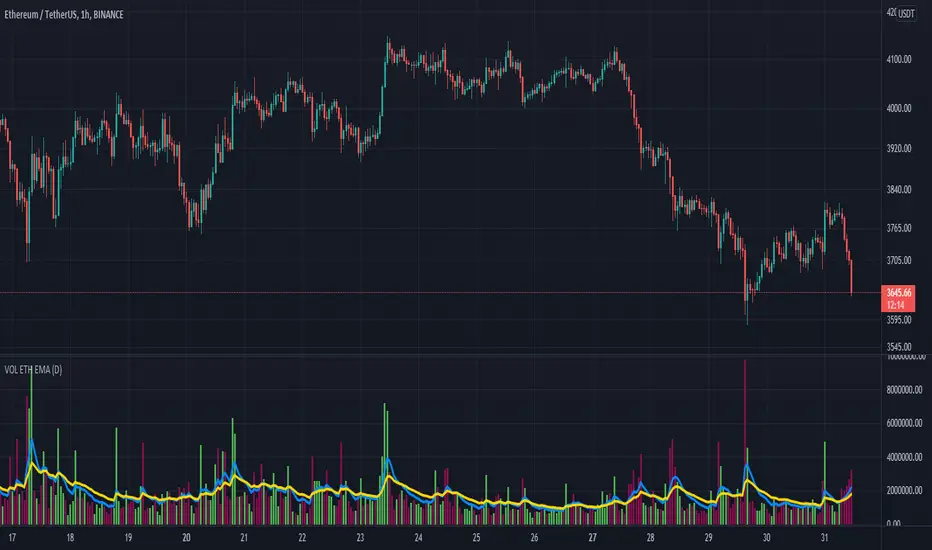
Volume Profile and Volume Indicator by DGTVolume Profile (also known as Price by Volume) is an charting study that displays trading activity over a specified time period at specific price levels. It is plotted as a horizontal histogram on the finacial isntrumnet's chart that highlights the trader's interest at specific price levels.
The histogram is used by traders to predict areas of support and resistance. Price levels where the traded volume is high could be assumed as support and resistance levels.
Price may experience difficulty moving above or below areas with large bars. Usually there is a great deal of activity on both the buy and sell side and the market stays at that price level for a great deal of time
It is advised to use volume profile in conjunction with other forms of technical analysis to maximize the odds of success
Light version of Volume Profile is added to Price Action - Support & Resistance by DGT
Pesquisar nos scripts por "volume indicator"
Performante's Average Ethereum Volume Indicator EMAThis indicator takes the volume from the biggest exchanges and plots the average volume. Exchanges incorporated in this average include Bitfinex, Coinbase, Bitstamp, Bitmex, Kraken, Binance, Bithumb, Flyer, OkEx, and CEX. The chart also has two Exponential Moving Averages (9-candle EMA & 21-candle EMA) added onto the volume pane to better understand relative volume. Thank you Julio and Mitch for this indicator
CDC DivergencesA handy little indicator to help identify different kinds of convergences/divergences
The indicator compares price movements with the momentum and volume movements, Hidden divergences are left out, at least in the first version, because I wanted this indicator to be as simple as possible.
The divergences are shown with labels, user can change the momentum/volume indicator used to identify divergences in the settings.
[FTA] Curvature of MeniscusIntroduction:
Curvature of Meniscus is a hybrid indicator comprised of three parts:
1. The first part is a heavily modified Demarker RSI which is represented as the histogram and is the main trend indicator C1 .
2. The second part is the 0 line which is replaced by the Waddah Attar Explosion V2 indicator C2 .
3. The third part is the background color which is borrowed from the Klinger Safety Zones volume indicator Vol .
It is smooth and has almost zero lag.
The signals can be used as per nnfx C1-C2-Vol algorithm.
The DeMarker indicator is relatively unknown to trading beginners but enjoys huge support from the more experienced traders. The indicator measures the strength of a trend and thus can give you a warning when a change in the trend direction might occur. This can not only help you to find new trade entries but also prevent you from entering into losing trades or letting your open trades run and ultimately result in a loss.
The line of the indicator is calculated as follows: First the indicator finds the minimal and the maximal value of the specified period. Afterwards those values are used to calculate the moving average of these values which then is displayed in the chart. Just like most oscillators the DeMarker indicator uses oversold and overbought zones at 0.3 and 0.7 to define good entry opportunities.
The "Curvature of Meniscus" indicator has the DeMarker indicator/RSI modified in three different ways:
1. Smoothed and almost no-lagged;
2. Colored histogram to determine the trend and the divergences;
3. An early signal line for those who like to take counter-trend trades/reversal entries.
Play with the settings and let me know what you think about this new hybrid!
Dull Volume by EpullemanDull volume indicator with Stochastic oscillator
Blue = Dull
Red = Super Dull
helps to determine low volume movement on oversold
Annualised Price Volatility %Annualised Price Volatility in percent, also called Instrument Risk, as outlined by Rob Carver in his excellent books, 'Systematic Trading' and 'Leveraged Trading'.
This is written for those who have read one of his books and want to use this tool on TradingView.
Trend strength, oscillators, and volume indicators are all the rage. Finding a great setup is, of course, key. You've decided to go long. Great!
But how much is your capital at risk?
How does that compare with your level of risk tolerance?
When trading, it's key to understand just how risky a certain instrument is. An uptrend is an uptrend, but is it at an annualised volatility of 2% per year or 500% per year? If it's the former, I know I can put a good chunk of capital into trading it. But if its the latter, I don't want to put so much money at risk. Volatility is rarely in a straight line. It's usually up and down.
I won't give the whole game away. To find out more about how to use this concept of risk, I'd highly recommend the books 'Leveraged Trading' and 'Systematic Trading' by Rob Carver.
Do you have any thoughts, ideas, or questions? Let me know in the comments or send me a message! I'd be glad to help you out.
DAX VolumeDAX index (DEU30) hourly volume indicator, which is obtained by adding the sum of the underlying stocks volume.
The volume is displayed in millions of EUR.
Dynamic Money FlowDynamic Money Flow is a volume indicator based on Marc Chaikin's Money Flow with a few improvements.
It can be used to confirm break-outs and trends.
Zero line crosses and divergences can provide useful signals while considering chart analysis as well.
Two weaknesses of CMF have been already fixed by Colin Twiggs (IncredibleCharts)...
1.CMF uses Chaikin's accumulation/distribution line to calculate the flow of money.
Accumulation/distribution line does not take the gaps into account. This can be solved using true range.
I call it true accumulation/distribution.
2.Oscillators have a tendency to center because of averaging calculations.
DMF is average of flowing volume divided by average of total volume. This means indicator plots the change of first factor compared to the other one. In Simple Averaging method every data is given an equal weight thus when the last data drops it will have heavy impact on the averages and the change of them.
It is much easier to identity these impacts after the drop of very high or very low data... So reducing the weight exponentially is a better option.
3.There is something else with CMF... changes of close price is ignored, because the formula only compares close price to its range.
To include the movements of close beside the close to range comparison, the distance between two last close prices should be compared to true range as well.
So volume can be distributed between close to range comparison (True Accumulation/Distribution) and close to close comparison automatically. And then results are summed to have a single multiplier.
An example for how close to close comparison affects DMF...
Or here you can see how lower wicks keep TMF (same as CMF in this case) from crossing zero line while price is trending down.
Volume LogA comfortable Volume Indicator with the following features:
Darker colors indicate positive changes
Light colors indicate negative changes
There are separate colors for changes above a configurable threshold
The threshold can look at percentages changes in either volume (directly) or the volume at log scale.
The graph itself is always displayed in regular format so the numbers indicate real value.
All the colors, log scale as well as the threshold are configurable through the visual interface.
Hashem OBV+EMA/MAThe On Balance Volume indicator (OBV) is used to measure buying and selling pressure.
It is a cumulative indicator meaning that on days where price went up, that day's volume is added to the cumulative OBV total. If price went down, then that day's volume is subtracted from the OBV total.
The OBV value is then plotted as a line for easy interpretation. OBV is primarily used to confirm or identify overall price Trends or to anticipate price movements after Divergences .
In addition to OBV, EMA and SMA are included. the EMA is used for Support and Resistances for the OBV. and the SMA is used by its Slope (can be S/R as well).
MACD VPT lag issue Most indicator use close as their primary source which is good but side effect of it is the lag in 1-2 candles
I created in the past the VPT indicator which is a volume indicator similar to OBV and I tranform it to be ised as a source insted of close . the reason for it since it a volume based indicator it faster and can help in the lag issue
So this script is just example how i change the source from close and put inside the VPT which make the MACD more responsive and faster
one problem of this indicator is that sometime it overshhot so with you can smooth it with len to desire result
So if you have lag indicator in one or two candels you can use this trick to try to solve it
Volume/Pricethis is simple volume indicator by price
see the following trend- when the candle is red there is spike in volume before the rise up and next green candle. the indicator will deflect down with green -the stronger the volume the stronger the down deflection, the next bar will be green and strong up.
with down it will be opposite
Money Flow Oscillator 2A volume indicator that measures buying and selling pressure over a given lookback period.
As described at traders.com
See also:
- Are price updates a good proxy for actual traded volume in FX?
- Using Tick Volume in Forex: A Clear NVO Based Example
Weis Wave ChartThis indicator is based on the Weis Wave described by David H. Weis in his book Trades About to Happen: A Modern Adaptation of the Wyckoff Method, more info how to use this indicator can be found in this video . The Weis Wave is an adaptation of Richard D. Wyckoff’s method Wave Charts. It works in all time periods and can be applied to all asset types.
Unlike other implementations I found here on TradingView, this implementation make use of a Renko-like zig zag pattern, very similar to how it is described in David H. Weis' book. The settings for the zig zag pattern are very similar to the standard Renko settings here on TradingView, in the "Renko Assignment Method" you either chose "ATR" or "Traditional" (read more about it here ). The ATR length or the brick size is then entered in the textbox "Value". You can also chose another setting in the "Renko Assignment Method" drop down named "Part of Price" which calculate the brick size from the current close and divide it by the value in the text box "Value". It is also possible to chose if the zig zag pattern shall use the high/low, the open/close or just the close as the most extreme values in its calculation, you select this in the drop down "Price Source".
TradingView's pine script does currently not support to print non-static text on the chart, so it is not possible at this point to write out the volume on the zig zag chart. It is also not possible to have both an overlay and separate chart pane in the same indicator, therefor this indicator is split up in two.
You can find the volume indicator here:
Normalized Volume by vosechuThis script adds a volume indicator that is normalized by SMA(50) by default. This will help you easily see whether the volume is _actually_ high or not. It also highlights when volume is exceeding the average by making the column a darker color.
Caveats:
* This changes the volume into a percentage, so don't use this number for calculations
Hints:
* Make sure to set your "bottom margin" to 0% or the volume chart will appear to be floating above the bottom
Options Volume IndicatorShows the RSI volume based on options volume. Useful for comparing against asset buy and sell signals to see strength of demand for recent options.
MOEX Day Volume24-hour trading volume indicator for a security in rubles with data on correlation with the Moscow Exchange Index
🧠 Quantum Regime Shift Detector v2.1🧠 Quantum Regime Shift Detector v2.1
This tool identifies market phase transitions — when conditions shift between stable and volatile regimes.
It blends volatility, trend strength, momentum, and volume dynamics to compute a Quantum Shift Score that highlights regime changes in real time.
🟩 Green = Stable Regime (calm, trending markets)
🟥 Red = Transition Regime (volatility spikes or reversals)
🟨 Yellow = Uncertain Zone
The histogram tracks regime states, while alerts trigger automatically when the market enters a new phase.
Use it to anticipate major shifts before price confirms them.
(Tip: pair with your favorite trend or volume indicator for confirmation.)
WM & HS Radar (Block-Free)The W/M + H&S Radar automatically scans for double-top/double-bottom (M and W) and head-and-shoulders style reversal structures across any timeframe.
How it works:
Detects repeating pivot formations that resemble W (double bottom) or M (double top) structures.
Draws neckline levels for each pattern and highlights potential breakout points.
Confirms breakout validity when price closes beyond the neckline (optionally requiring a 1.2× volume surge).
Generates alerts when a valid W Long or M Short trigger occurs.
Best used on: 15m, 1h, or 4h charts to identify medium-term reversal entries.
Recommended companion: Orion Daily HL + Volume indicator for higher-timeframe context.
Alert Options:
“W Long Trigger” → Bullish reversal breakout.
“M Short Trigger” → Bearish reversal breakout.
Usage Tip:
Combine with your support/resistance zones and ATR-based stop sizing from your Money Momentum Tracker to validate A-setups only.
Nifty 50 Weighted Volume IndicatorThis takes the volume of the cash market as per the composite weighted average of the Nifty 50 Components.
You can use this at your discretion to take calls on Index trades.
High Volume Highlight - Pto compare volume indicator from prev bars. How to use it, short it when the red bar shows and long it when the green bar shows
VIDYA (Chande)This script brings you VIDYA – the Variable Index Dynamic Average, developed by Tushar Chande. It’s not your typical moving average. Unlike the standard SMA or EMA, VIDYA adapts its speed and smoothness based on real-time market momentum using the Chande Momentum Oscillator (CMO).
Think of it like a moving average that gets faster during strong trends and slows down during sideways or choppy markets — just like how a smart trader would!
🧠 What Makes VIDYA Different?
Traditional moving averages use fixed smoothing, so they lag more during big moves or chop during weak trends.
VIDYA fixes that by adapting its behavior dynamically:
When momentum is strong → VIDYA reacts faster 🚀
When momentum is weak → VIDYA smooths out the noise 🧘
⚙️ How It Works (Explained Simply):
1️⃣ CMO Calculation (Chande Momentum Oscillator):
We look at the past cmoLength candles (default 9) and:
i) Add up all the positive price changes (gains)
ii) Add up all the negative price changes (losses)
iii) Use those to compute a normalized momentum score between -100 and +100
📌 CMO = (Gains - Losses) / (Gains + Losses)
• This gives us a momentum reading that powers the next step.
2️⃣ Dynamic Alpha Smoothing:
• We convert the absolute value of the CMO into an alpha — this is the "speed" of the VIDYA.
📌 Higher momentum = higher alpha → faster response
📌 Lower momentum = lower alpha → smoother behavior
3️⃣ VIDYA Formula:
• Finally, we apply the smoothing:
📌 VIDYA = α × Price + (1 - α) × Previous VIDYA
• This equation continuously adapts to market behavior — trending or ranging.
📊 What’s Plotted?
🟠 The VIDYA Line:
A smooth, responsive line plotted on your price chart that adjusts in real-time with price momentum.
🔎 How to Use It:
✅ Use it like a moving average, but smarter:
• Price > VIDYA and rising → Trend is likely up
• Price < VIDYA and falling → Trend is likely down
• Flat VIDYA = Possible consolidation or sideways market
✅ Combine with:
• Breakout strategies (VIDYA confirms momentum)
• Reversal entries (look for price crossing VIDYA)
• Volatility filters (ignore signals when VIDYA flattens)
🧪 Bonus Tip:
Pair this with a volume indicator (like my Volume Confirmation Bars or Volume Strength Highlight) to confirm whether momentum is backed by real participation or just a fakeout.
📩 Want alerts, dual-timeframe overlays, or VIDYA with other base inputs (like typical price or HLC3)? Let me know — happy to expand this for your setup!
Stay adaptive, not reactive — trade smarter with VIDYA! 🧠📉📈


